The data set used for this post consists of 15,150 classic hits from 3,083 artists, from around 1900 to 2023. Because they are taken from Spotify, they also contain a series of variables that describes the quality of the music, in terms of its things like its loudness, tempo, and energy, for example. With such data, we can see how popular music and its consumption have evolved over time.
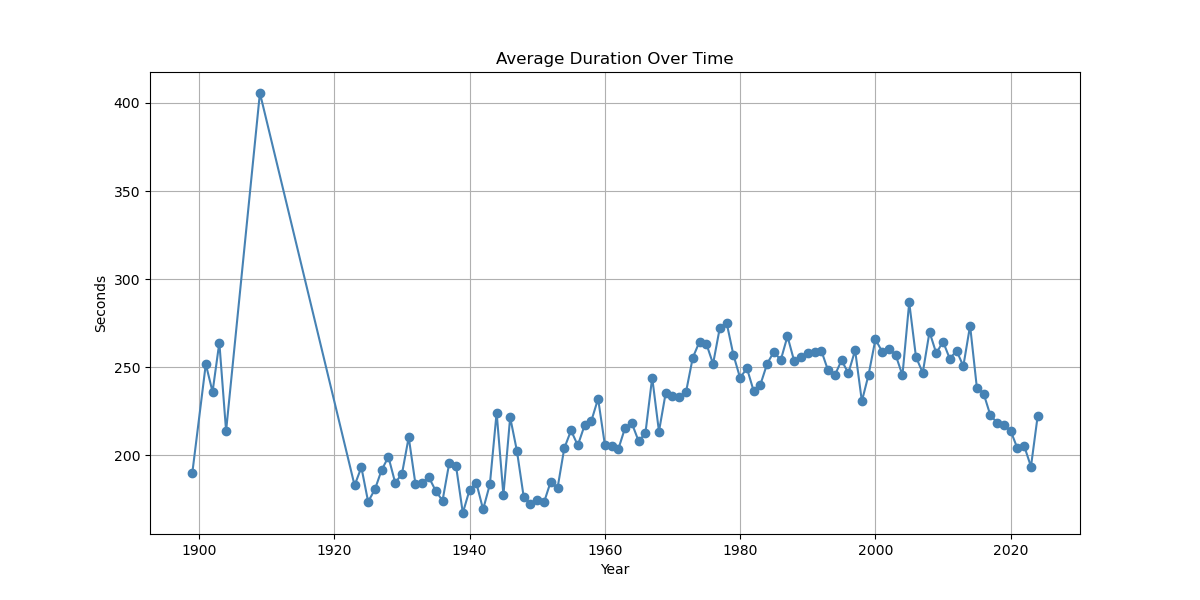
As seen in the graph below, the average duration of a had risen from about the 1940s right up to the 1980s, before plateauing up until the late 2000s; thereafter the average duration declined sharply. This decline coincides with the advent of streaming – as more music is available, musicians produce less to account for conflicted attention spans.
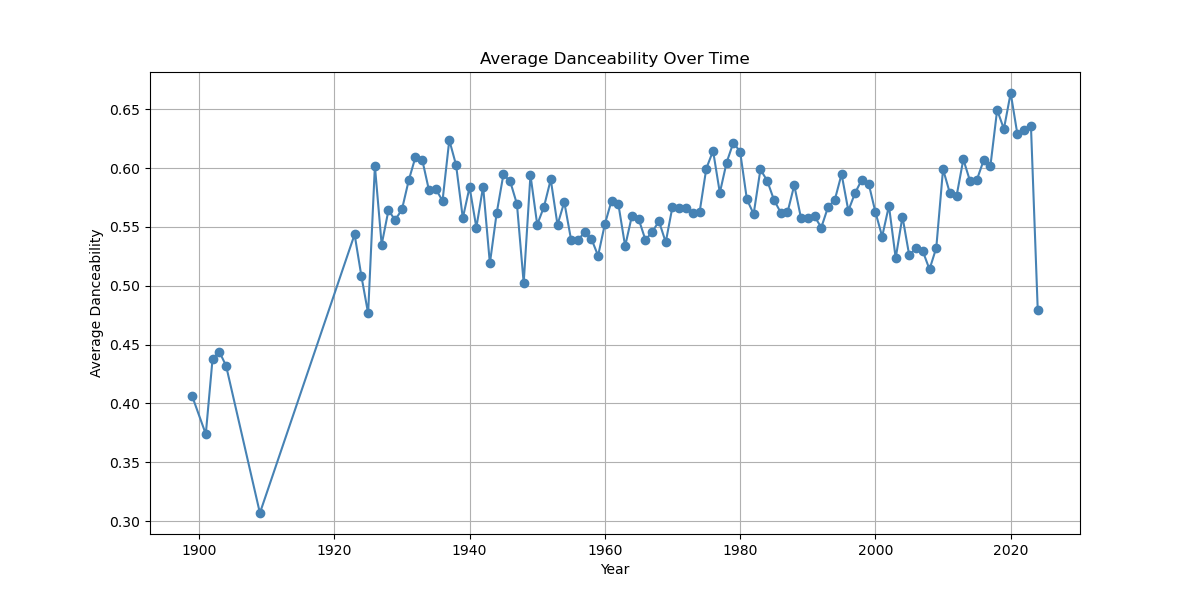
Spotify also contains a metric that measures the danceability of a song – how suited it is for dancing, ranging from 0 to 1. As seen below, this shot up from the early 1900s to 1940 before holding roughly constant at around 0.55 to 0.66 on average, until around 2000. Since then, it has increased to a high of over 0.65. Note there is an outlier for 2023, something observed for this datapoint across metrics.
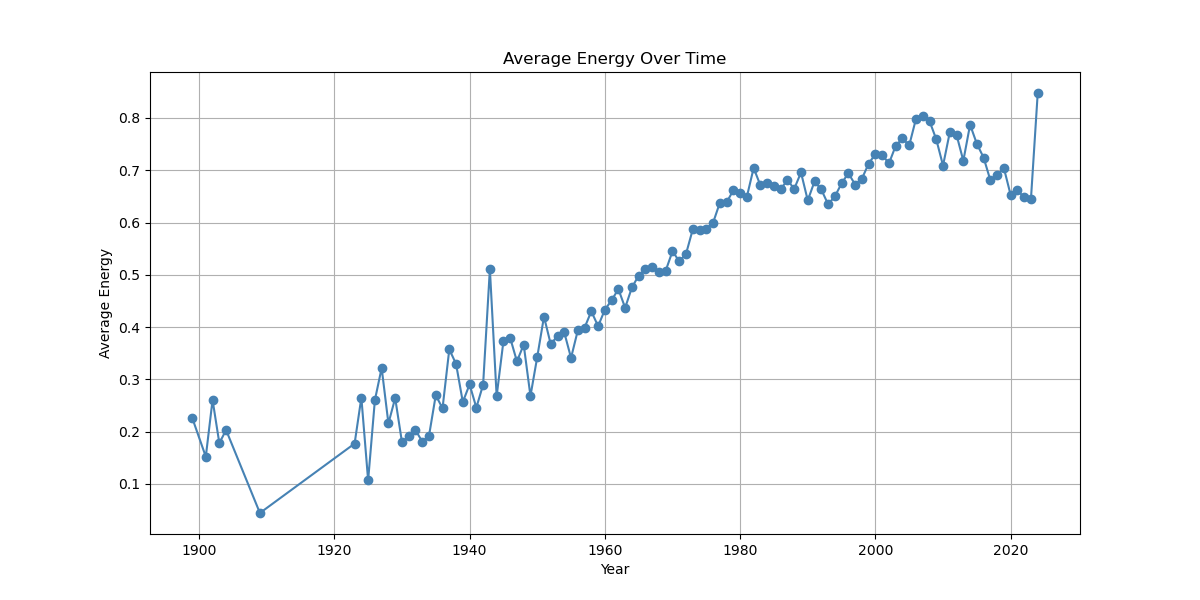
Energy is defined as the intensity and activity of a song. This had been increasing in a more or less linear fashion, with perhaps a slight pause during the 1980s. Around 2004, this went into decline, although again, 2023 is an outlier.
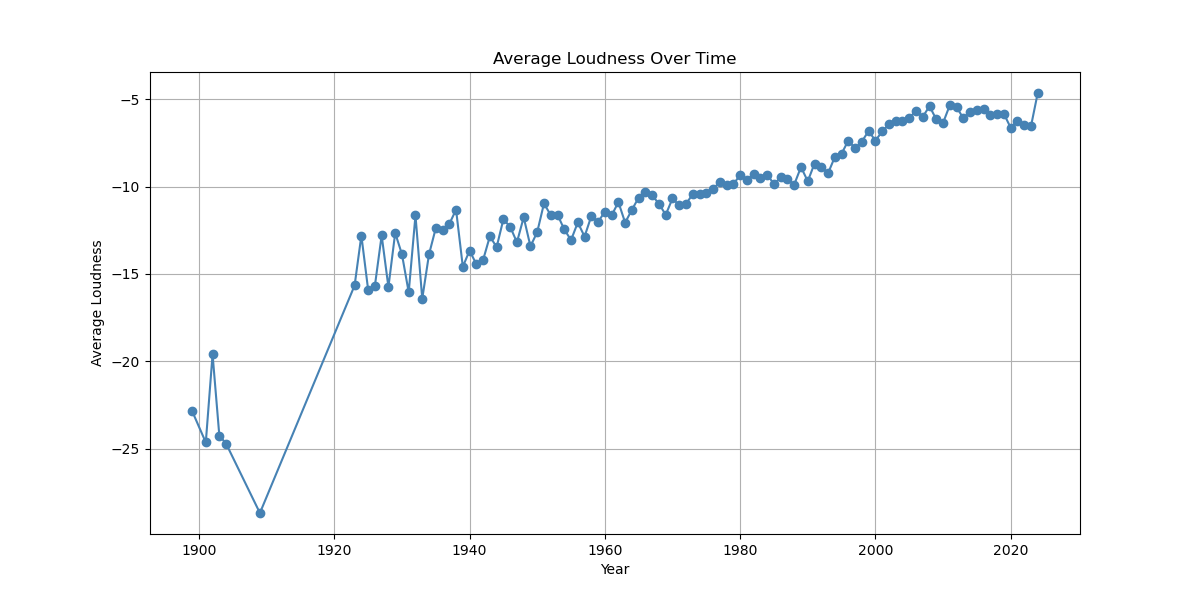
Popular music has been getting steadily louder although that trend appeared to stop around the early 2000s. Perhaps the demand for louder music stopped when people began to listen more on personal earphones?
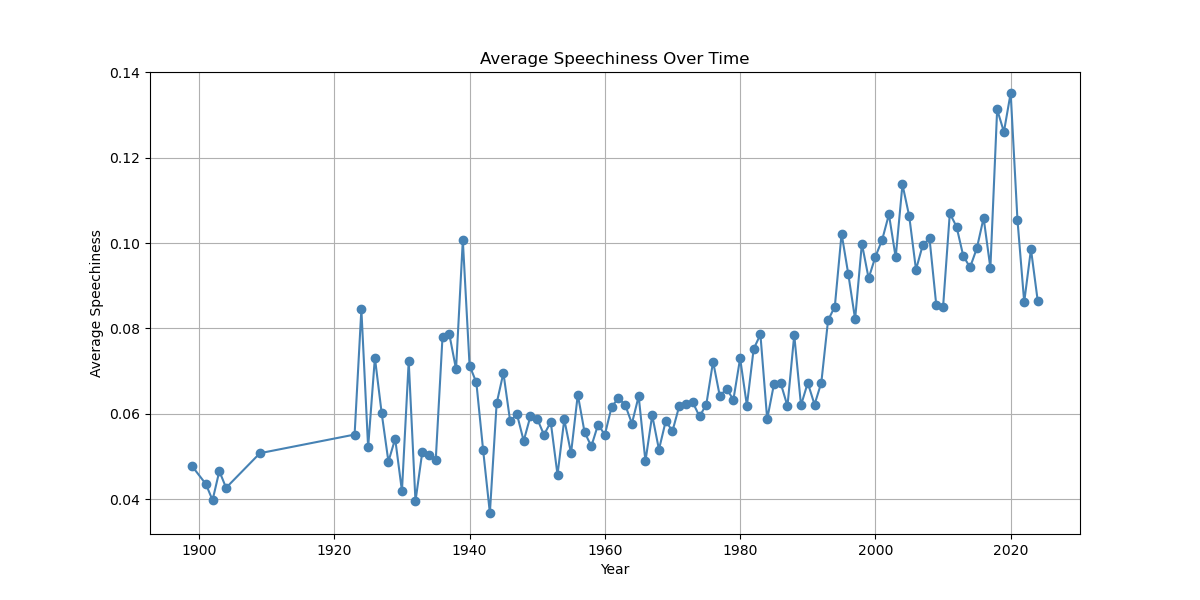
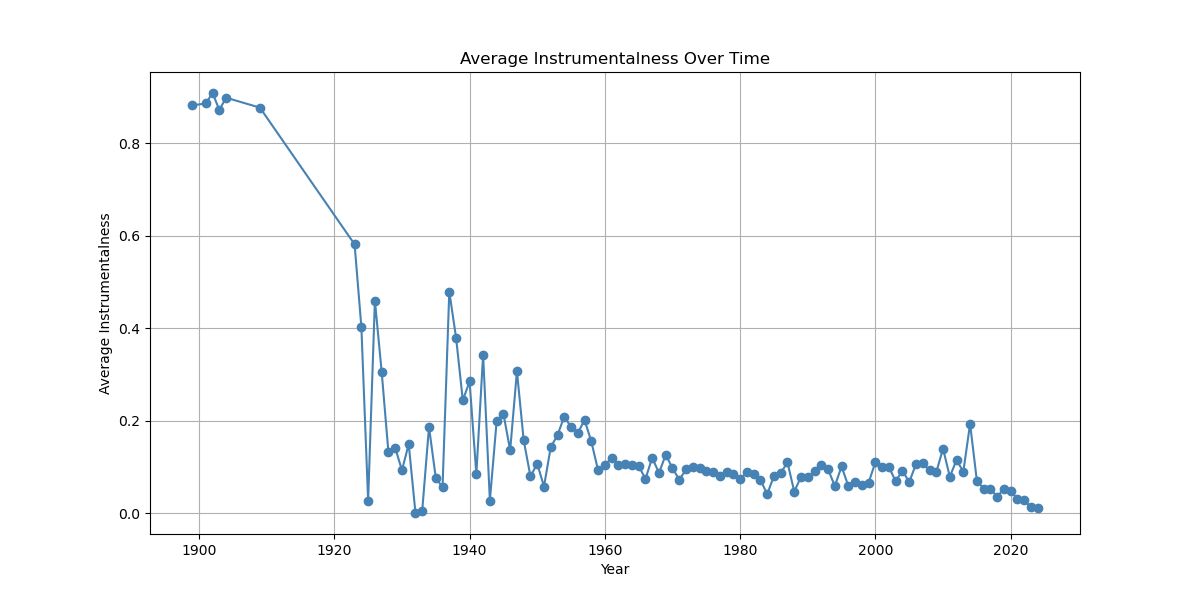
Next up we have measures of ‘speechiness’ and ‘instrumentalness’, these being measures of the presence of spoken words in the track and the likelihood the track is an instrumental respectively. Looking at the next two graphs below, we see two things, music has become less musicy and more talk talk talk. It is curious that the decline of the instrumental had been arrested for most of the 1960s through to the early 2000s. It is only in more recent years that we have seen the decline commence again.
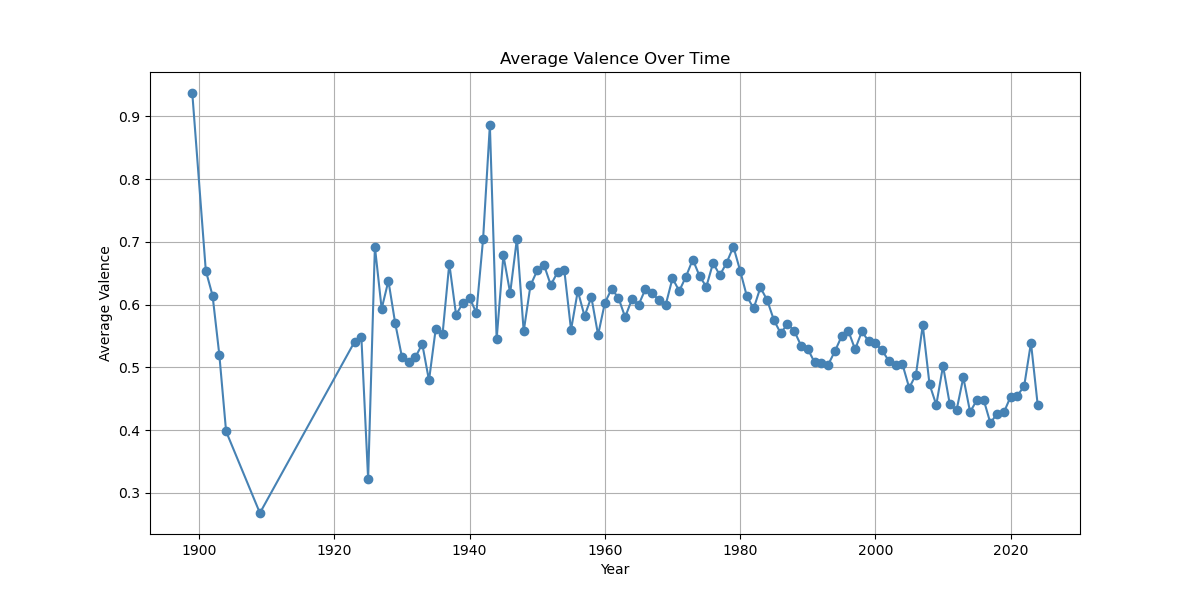
Next up, we have the average ‘valence’ score over time, this being a measure of “musical positiveness”. It is interesting that this had been increasing from the 1920s right up to the 1980s, then funnily enough, it collapsed to coincide with the Reagan and Thatcherite shift. Also note the rapid decline at the beginning of the time series, which I guess may have something to do with small numbers of observations.
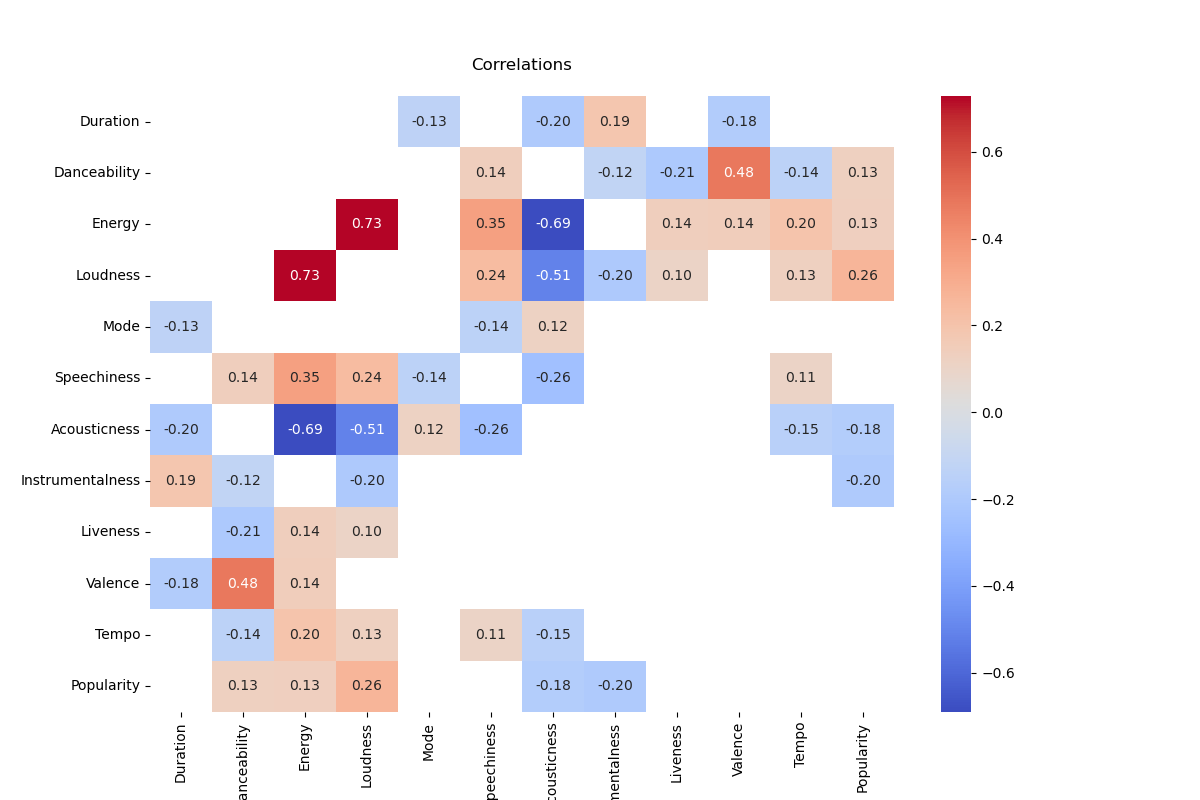
How do all these variables inter-relate? The figure below presents their spearman correlation coefficient matrix (between -0,1 and 0.1 omitted). The strongest correlation is between energy and loudness – music that is more energetic tends to be loud. But these are both negatively associated with ‘accousticness’. Generally, music that is more danceable tends to be more positive (valence) although the correlation is moderate. Otherwise, there are mostly weak to moderate correlations for the other variables. Most interestingly, popularity does not strongly correlate with other variables, with the strongest being with loudness at 0.26. Louder music is more popular, to some extent. I guess there is no accounting for taste.
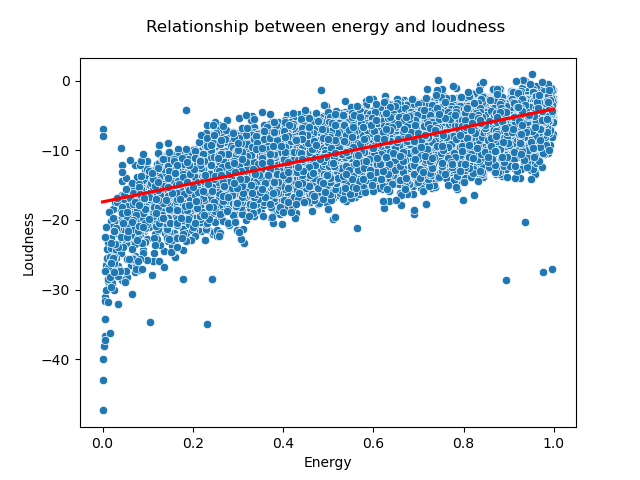
Finally, the graph below shows the relationship between loudness and energy indicating the strong correlation between them.
So, music is getting louder, less musical, more talky, but mercifully shorter.