People get their news through a variety of sources while the town crier is a distant memory, wheeled out only for fetes. But can we identify patterns of consumers through survey data?
The World Values Survey 2022 contains the following question:
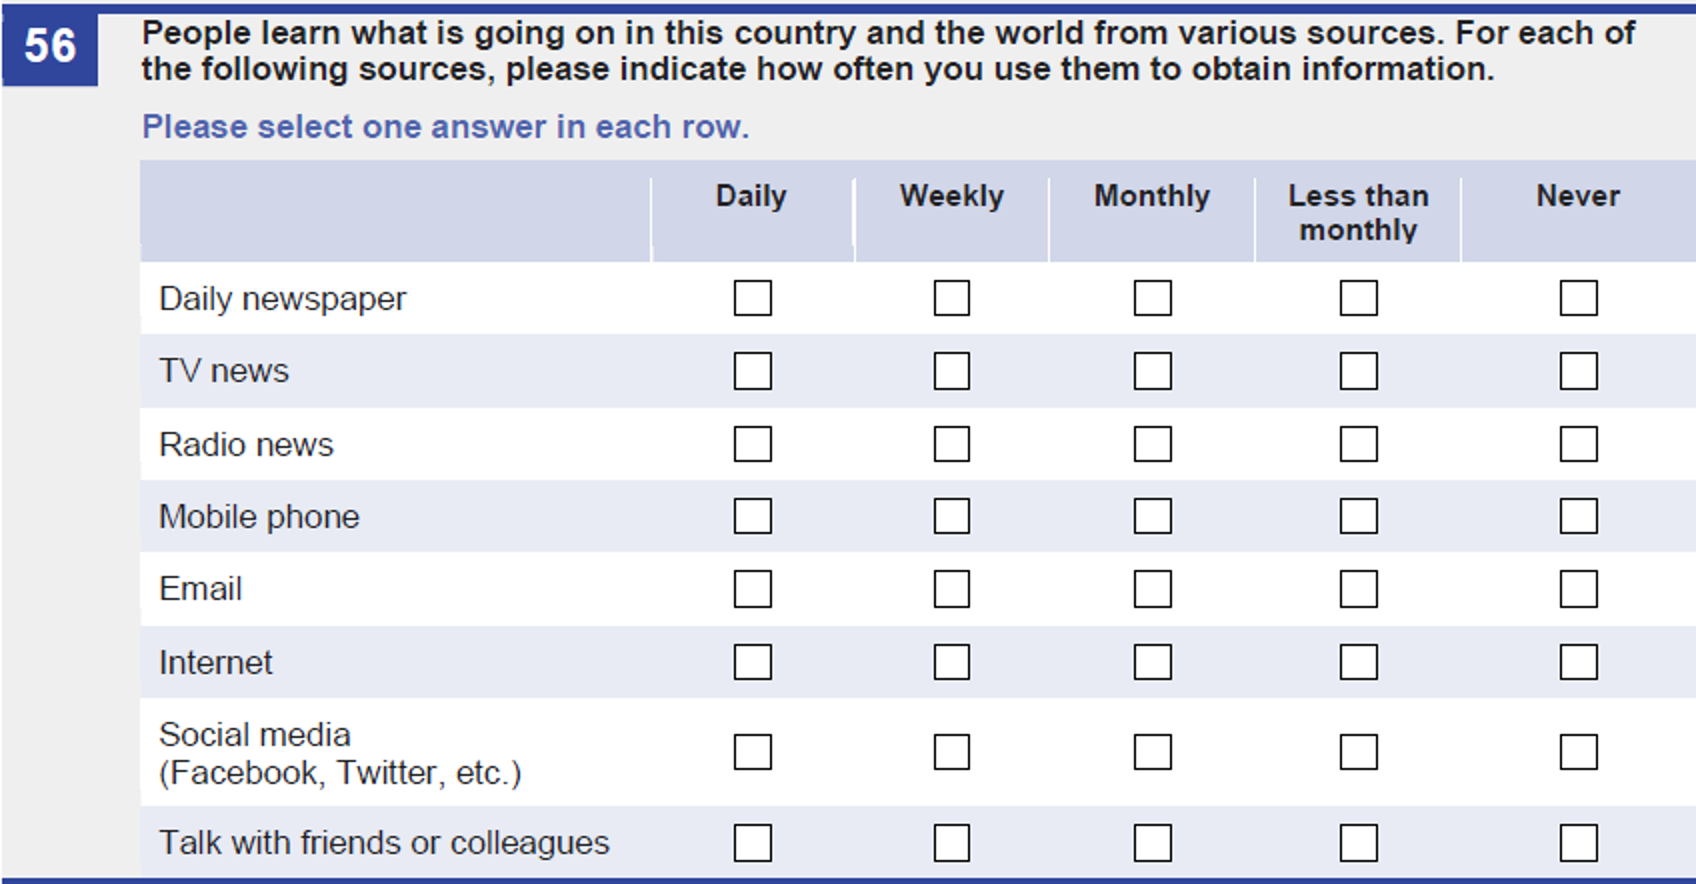
Below are presented summary statistics of the answers given. The sample size is just over 3,000.
Summary statistics (per cent – unweighted)
| Daily | Weekly | Monthly | Less than monthly | Never | |
|---|---|---|---|---|---|
| Newspaper | 21 | 13 | 5 | 15 | 45 |
| TV | 57 | 19 | 5 | 8 | 11 |
| Radio | 44 | 17 | 5 | 11 | 22 |
| Mobile | 63 | 9 | 2 | 4 | 20 |
| 28 | 12 | 5 | 11 | 44 | |
| Internet | 64 | 14 | 3 | 4 | 15 |
| Social media | 46 | 12 | 3 | 5 | 33 |
| Word of mouth | 34 | 40 | 10 | 7 | 8 |
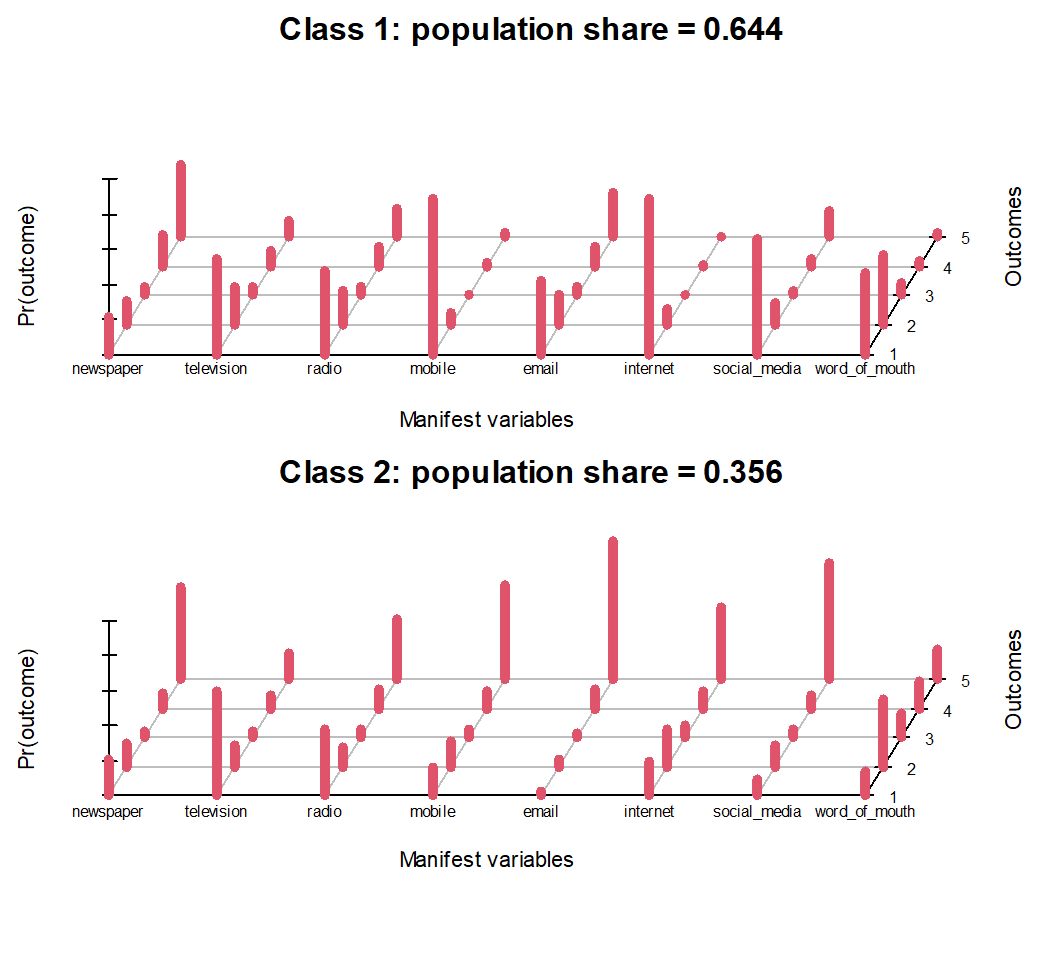
Can we use this to create a segmentation of types of consumer? Latent class analysis was applied, using the polCA package in R. Two classes were identified based on the Bayes Information Criterion (BIC). Results are presented graphically below.
These latent classes are interpreted as:
- Class one: modernists who use frequently modern technologies as well as more traditional sources, at around two thirds of the population
- Class two: traditionalists who mostly get their news from television but tend to shun more modern technologies and who make up around a third of the population
Results of latent class analysis (conditional item response probabilities, 1 = Daily, 5 = Never)
Next the model was re-estimated but with covariates for sex, age, education, political party support, and democratic satisfaction specified. This in effect turns the model into a logistic regression with a latent class binary dependent variable. Results are presented below. As we can see, there are no differences between the sexes in latent class membership, that is to say, the likelihood of being a modernist or traditionalist.
Older people are more likely to be traditionalists which is unsurprising. Also, the more educated a person is, the less likely they are to be a traditionalist. There are few differences between supporters of different parties, although the ‘other’ category presumably composed of non-affiliates, is most likely to be traditionalists. There is no relationship with democratic satisfaction.
Latent class regression of being in Class 2 and not Class 1
| Coefficient | Std. error | Significance | Odds ratio | ||
|---|---|---|---|---|---|
| Constant | -5.03 | 0.4 | *** | 0.01 | |
| Sex (ref = male) | Female | 0.19 | 0.12 | 1.21 | |
| Age | 0.07 | 0 | *** | 1.08 | |
| Education (ref = GCSE or below) | A-level or similar | -0.4 | 0.15 | *** | 0.67 |
| Degree or higher | -0.93 | 0.16 | *** | 0.39 | |
| Other | -0.21 | 0.3 | 0.81 | ||
| Labour | 0.07 | 0.19 | 1.07 | ||
| Liberal Democrats | -0.17 | 0.25 | 0.84 | ||
| Green | 0.54 | 0.3 | * | 1.71 | |
| Reform/UKIP/Brexit | 0.4 | 0.41 | 1.49 | ||
| SNP | 0.31 | 0.28 | 1.36 | ||
| Other | 0.6 | 0.19 | *** | 1.82 | |
| Democratic satisfaction (1-10) | 0.04 | 0.03 | 1.04 |
*** p<0.01, ** p<0.05, * p<0.10
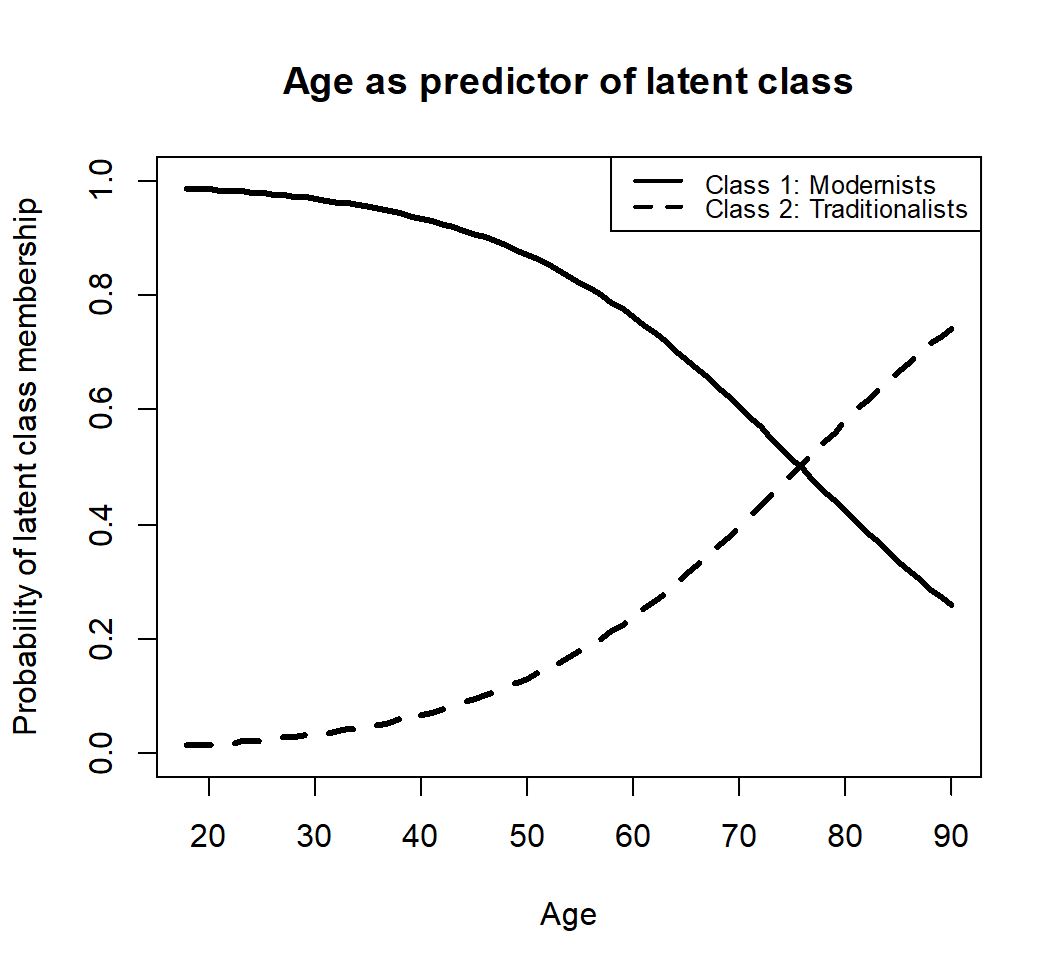
Finally, the graph below shows the modelled effect of age on latent class membership. As age goes up, the probability of being a traditionalist increases while that of being a modernist declines.
So, to conclude…
- There are two tribes of consumption
- One adept across all technologies at around two thirds of the population
- The other comfortable only with more traditional forms of media consumption, at about one third
- They are divided by age and education and to some extent politics
- But not sex or democratic satisfaction